X
  • No products in the list

Improving Iron Ore Fragmentation With Varistem

Table of Contents

Varistem® Blast Stemming Plugs Trials

Iron ore fragmentation plays a crucial role in the efficiency of mining operations, directly impacting the performance of processing plants. The following study focuses on the improvement of particle size distribution (PSD) through the use of Varistem® blast stemming plugs in iron ore mines. By conducting comprehensive trials and comparing historical data with the results obtained from using Varistem®, this analysis aims to demonstrate the benefits of optimized fragmentation in enhancing plant performance and reducing operational costs.

Introductory Comments 

Particle Size Distribution (PSD) Context

In order to understand and analyse the particle size distribution (PSD) data and how it fits into the plant design curve the following needs to be noted.
  • The muckpile (material remaining after a blast block) is analysed and categorized in terms of the percentage of material passing a specific size.
  • The distribution of this size data is illustrated on the PSD and entails a variety of sizes from fines (small) to coarse (large) material
  • A set of data/distribution curve has to be viewed holistically

Plant Curve & Important parameters

  • The processing plant works optimally when the particles fed through the plant is in a specific size range (Envelope range)
  • The plant has a maximum range of large particles that it can process (upper/Coarse envelope limit)
  • The plant has a maximum range of small particles that it can process (lower/fines envelope limit) 
  • The plant has an ideal range of particle sizes that allows it to run optimally (Nominal design curve)
  • Effort should be made to produce a particles size distribution that fits within the lower and upper distribution envelope, and ideally sits on the Nominal curve. 

Important data to consider in an envelope is your:

  • P10 (Fines): 10% of the material is smaller than the indicated size (mm)
  • P50 (Median): 50% of the material is smaller than the indicated size (mm)
  • P90 (Oversize): 90% of the material is smaller than the indicated size (mm)
  • P99.95 (Topsize): 99,95% of the material is smaller than the indicated size (mm)

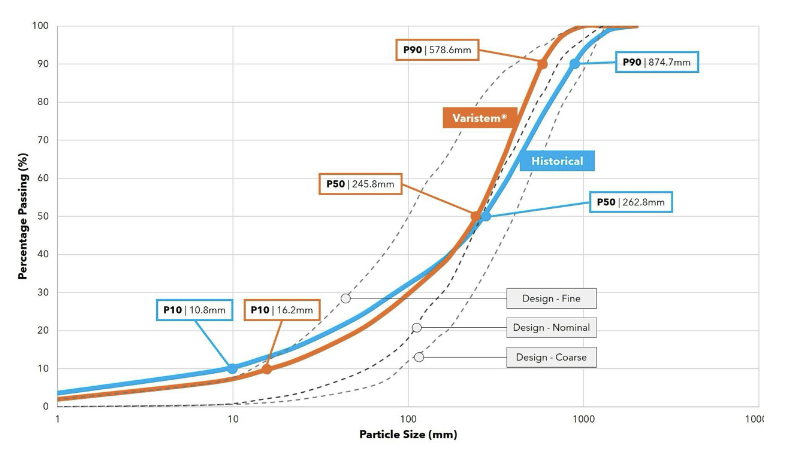
Particle size distribution comparison – iron ore mine x

Screenshot 2024 06 07 at 12.47.00
  • P10: Less fines with Varistem® and inside design envelope, thus better conformance resulting in an improvement for the plant.
  • P50: More or less same deviance from nominal.
  • P90: Less oversize with Varistem®, thus efficiency gains for loading and crushing.
  • Topsize: Varistem® 961mm vs. Historical 1521mm (a reduction of 37%).
  • Steepness: Varistem® line steeper meaning there is a lesser variance in overall PSD.
  • Varistem leads to better energy retention that causes the PSD to be more consistent throughout the block. This allows for adjustments in blast design to be made more easily as the variance is better controlled when Varistem® is used.
AD 4nXdBxQGZmingnduxpqf9XqdUOl2BeqN9MGLGKwpD3DGxki9Er7Bx6g9ro

Iron Ore Mine X – Analysis with regard to the Nominal

The analysis will be done comparing the average of the historical blast results, and the Varistem® blast results to the Nominal curve (the most optimal curve)

  • The plant requires less than 3,5% of material to be larger than 1000mm, and none larger than 1300mm. Historic data shows that 6,4% of material is larger than 1000mm (83% more than required) with Varistem® data at 0% larger than 1000mm.
  • The topsize particles (P99.95) has been reduced from 27% coarser, to 20% finer than the nominal curve requirements. This is a 47% reduction in the top size particles allowing for efficiency gains in loading & hauling, and crusher throughput.
  • Oversize particles (P90) has been reduced from 22% larger than the nominal size to 19% smaller than the nominal. This 41 % reduction in oversize allows for efficiency gains in loading and hauling cycles, and crusher throughput. It also reduces costs for secondary breakage.
  • 50% of the material is more or less the same size with historic data at a 2% deviation from the nominal, compared to 8% for Varistem®. Both Historic and Varistem® data is on the finer side of the curve.
  • The use of Varistem® has improved the fines (P10) conformance curve with 9% from historic data. The fines from historic data was outside of the allowable envelope. Varistem® helped to reduce fines to an extent that it is now 25% coarser than the maximum fines allowed.
  • The overall size difference (difference between largest to smallest size) for the nominal curve is 1140mm, 1510mm for historic and only 944mm for Varistem®. This indicates an overall more uniform size distribution that allows for increase efficiency in the plant.

Particle size distribution comparison – iron ore mine Y

AD 4nXdxCtKQpCTmERmu1JcQsy65h2nh0A3vA8uR0XgjPgaTO 0vgfWdYKnpk22xWuITsOcP0wCUQwNi4SQP1 A6FnE4YMb7TyzfenL4Ft7PEKFlEBmRcMz6hdk3MSwg9b6yG2nP9evVB4Q9XHL1gCgOcswk77Ge?key=hFfJup4dFd6VVkrDESV1Rg
  • P10: Less fines with Varistem® and inside design envelope, thus better conformance resulting in an improvement for the plant.
  • P50: Major difference with Varistem® showing better conformance to the nominal line.
  • P90: Varistem® conforms to the nominal curve meaning it is more ideal for the plant.
  • Steepness:  Varistem®  line  conforming  more  to nominal.
  • With the use of Varistem® the energy is retained longer causing the energy to be distributed more consistently throughout the block leading to better conformance to the nominal line. Once again this allows for adjustments in blast design to be made more easily as the variance is better controlled when Varistem® is used.
AD 4nXddbts9iIO DLes6TdQ8m7Q4haLGdwWayb5y6GtIOSQT4lddfXJ3DSu8teekV3UEWKvjwkclOuQfHd7lEPnF8JkzO2M8belltfqSY cqEzKgNYuaeBuoVeQH79CdDGfL

Iron Ore Mine Y 

The analysis will be done comparing the average of the historic blast results, and the Varistem® blast results to the Nominal curve (the most optimal curve). It is important to note that the historic data on Iron Ore Mine Y indicates that the majority of the material is way too

fine, sitting outside of the required envelope or just on the maximum required fines. Varistem® has helped to improve on the by reducing the fines to an extent that it is within the envelope and almost matches the nominal curve for about 60% of the material

  • The plant requires less than 2,5% of material to be larger than 1000mm, and none larger than 1300mm. Historic data shows that 0% of material is larger than 1000mm with Varistem® data at 1,3% larger than 1000mm well within the envelope.
  • The deviation of the topsize particles (P99.95) has been reduces from 33% to fine material, to only 2% finer than the nominal curve requirements. This is a 31% improvement on conformance of the topsize to the nominal curve by Varistem® compared to historic.
  • Deviation of the Oversize particles (P90) has been reduced from 50% to fine material, to only 10% finer than the nominal curve requirements. This is a 40% improvement on conformance of the oversize to the nominal curve by Varistem® compared to historic. Historic data was outside the fines envelope and has been improved to sit well within the required envelope. This improvement allows for efficiency gains in loading and hauling cycles, and crusher throughput. 
  • 50% of the material showed a deviation of 61% to fine from the nominal curve and has been improved to a mere 4% deviation to the coarser side of the nominal curve. This 65% improvement in making the material coarser with Varistem® has allowed the particle distribution to align with the majority of the nominal curve. This is a major gain and will increase plant performance and reduce maintenance dramatically.
  • The deviation of the maximum allowable fines from the nominal (according to the plant curve) is 80%. Historic data showed that the majority of fines did not at all conform to the envelope at a deviation of 91%. The use of Varistem® has improved the fines (P10) conformance curve with 13% from historic data allowing the material to fall within the required plant design curve

Conclusion

The results of the Varistem® trials in both Iron Ore Mine X and Iron Ore Mine Y clearly indicate significant improvements in particle size distribution compared to historical data. The use of Varistem® has led to a reduction in topsize and oversize particles, better conformance to the nominal curve, and a more uniform size distribution overall. These improvements translate to increased efficiency in loading, hauling, and crusher throughput, as well as reduced secondary breakage costs. By aligning the PSD more closely with the plant’s design envelope, Varistem® enhances operational performance, ultimately contributing to more efficient and cost-effective mining processes. This study underscores the value of adopting advanced blast stemming technologies in optimizing ore fragmentation and achieving sustainable mining operations.

Explore Our Articles

Introduction

Blasting is the first step in the mining value chain, and any positive impacts made during blasting result in exponential downstream gains. In the case

Read More »
We use cookies on our website to see how you interact with it. By accepting, you agree to our privacy policy and the use of such cookies.